dbtQuickSightData EngineeringAutomation
Automated BI Reporting Pipeline
2025Client project
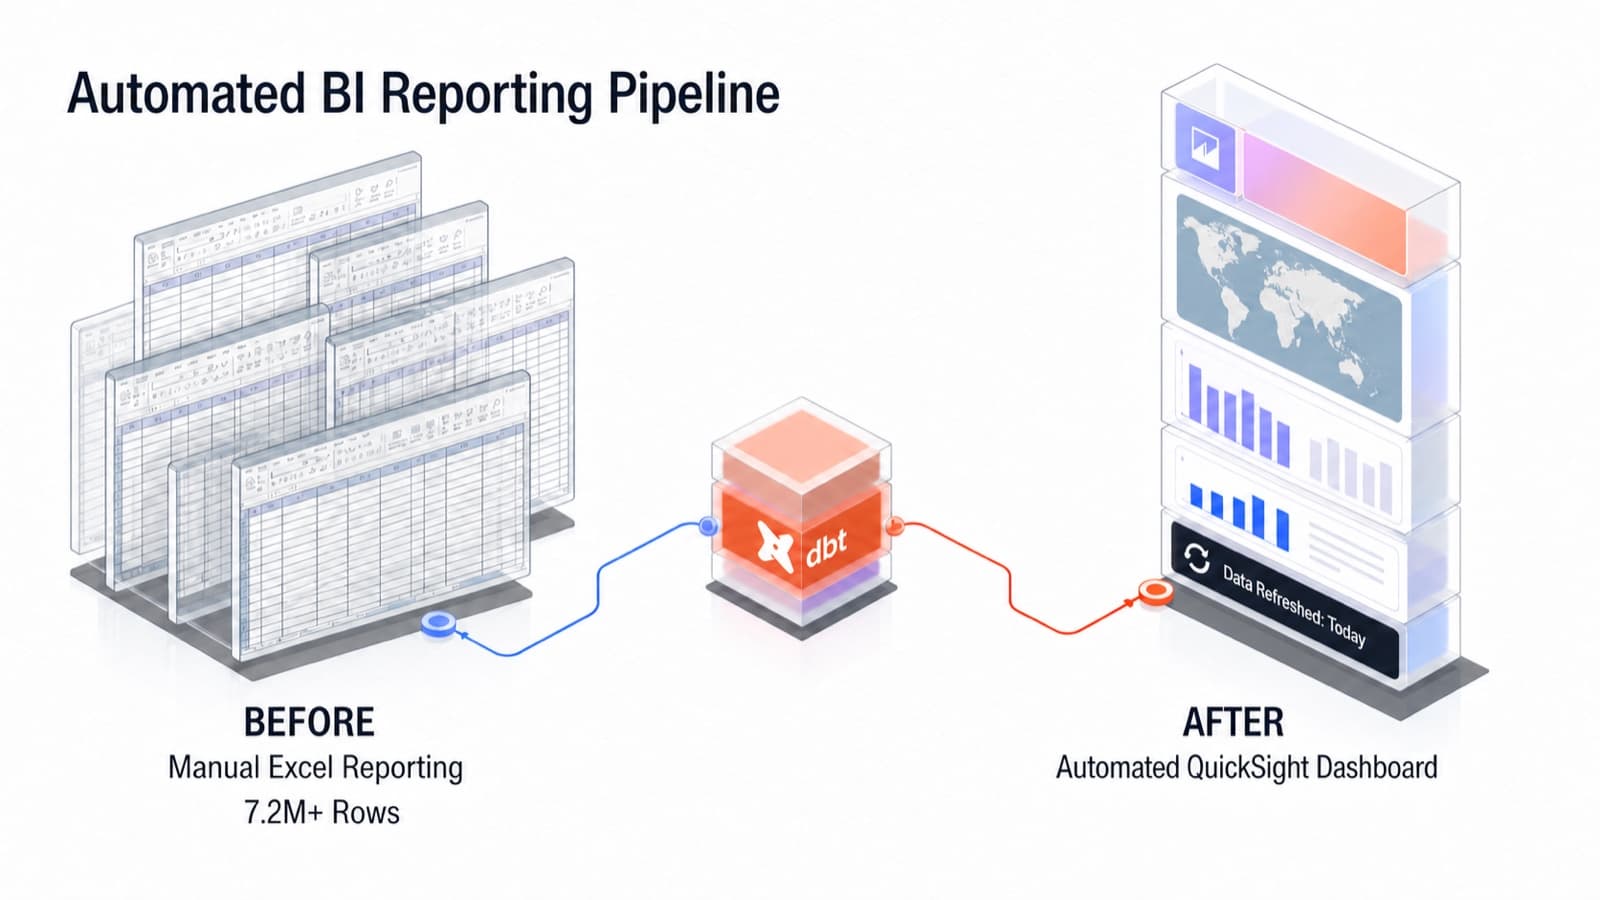
A client reporting pipeline built over more than 1TB of source data and 7.2M reporting rows, using dbt, Amazon QuickSight, and scheduled daily refreshes.
The problem
The client produced quarterly and yearly reports manually in Excel. They described the process as taking days and requiring substantial effort.
How it works
- 01, InputSource data
More than 1TB of client data, kept separate from reporting workloads.
- 02, Tool or codedbt reporting layer
Tested, documented models producing 7.2M reporting rows.
- 03, OutputQuickSight dashboards
Client-facing dashboards in Amazon QuickSight.
- 04, Tool or codeDaily refresh
Scheduled refreshes replace manual Excel reporting.
↺ Every day: back to step 02
What I did
- Independently built a dbt reporting layer over more than 1TB of source data and 7.2M reporting rows.
- Kept reporting workloads separate from the source data and added tests and documentation to the models.
- Built the client-facing dashboards in Amazon QuickSight and scheduled daily refreshes.
Results
- Replaced a reporting process the client described as taking days with dashboards refreshed each day.
- Delivered a repeatable reporting workflow for the team and its clients.